Apple Charts — LineMark, AreaMark, and the Sparkline Pattern
Apple’s Charts framework (introduced WWDC 2022, mature in 2026) is the right answer to “draw a chart in SwiftUI” for 95% of cases. Declarative, composable, accessible, supports almost every chart type from LineMark to BarMark to RuleMark to SectorMark. Doesn’t require the framework’s name to be capitalized, which is more than I can say for some Apple frameworks.
This lesson adds a price-history chart to Pulse’s market detail screen — LineMark for the line, AreaMark underneath for the gradient fill, axes hidden where they’d add noise, customized where they earn their place. Snippets cover three patterns: the basic line+area sparkline, custom axis formatting, and the tap-and-drag interactive selection added in iOS 17.
Line + area sparkline — the everyday chart
Compose AreaMark and LineMark for the same dataset. The area gives you the gradient fill that makes a chart look “alive”; the line on top gives you precision.
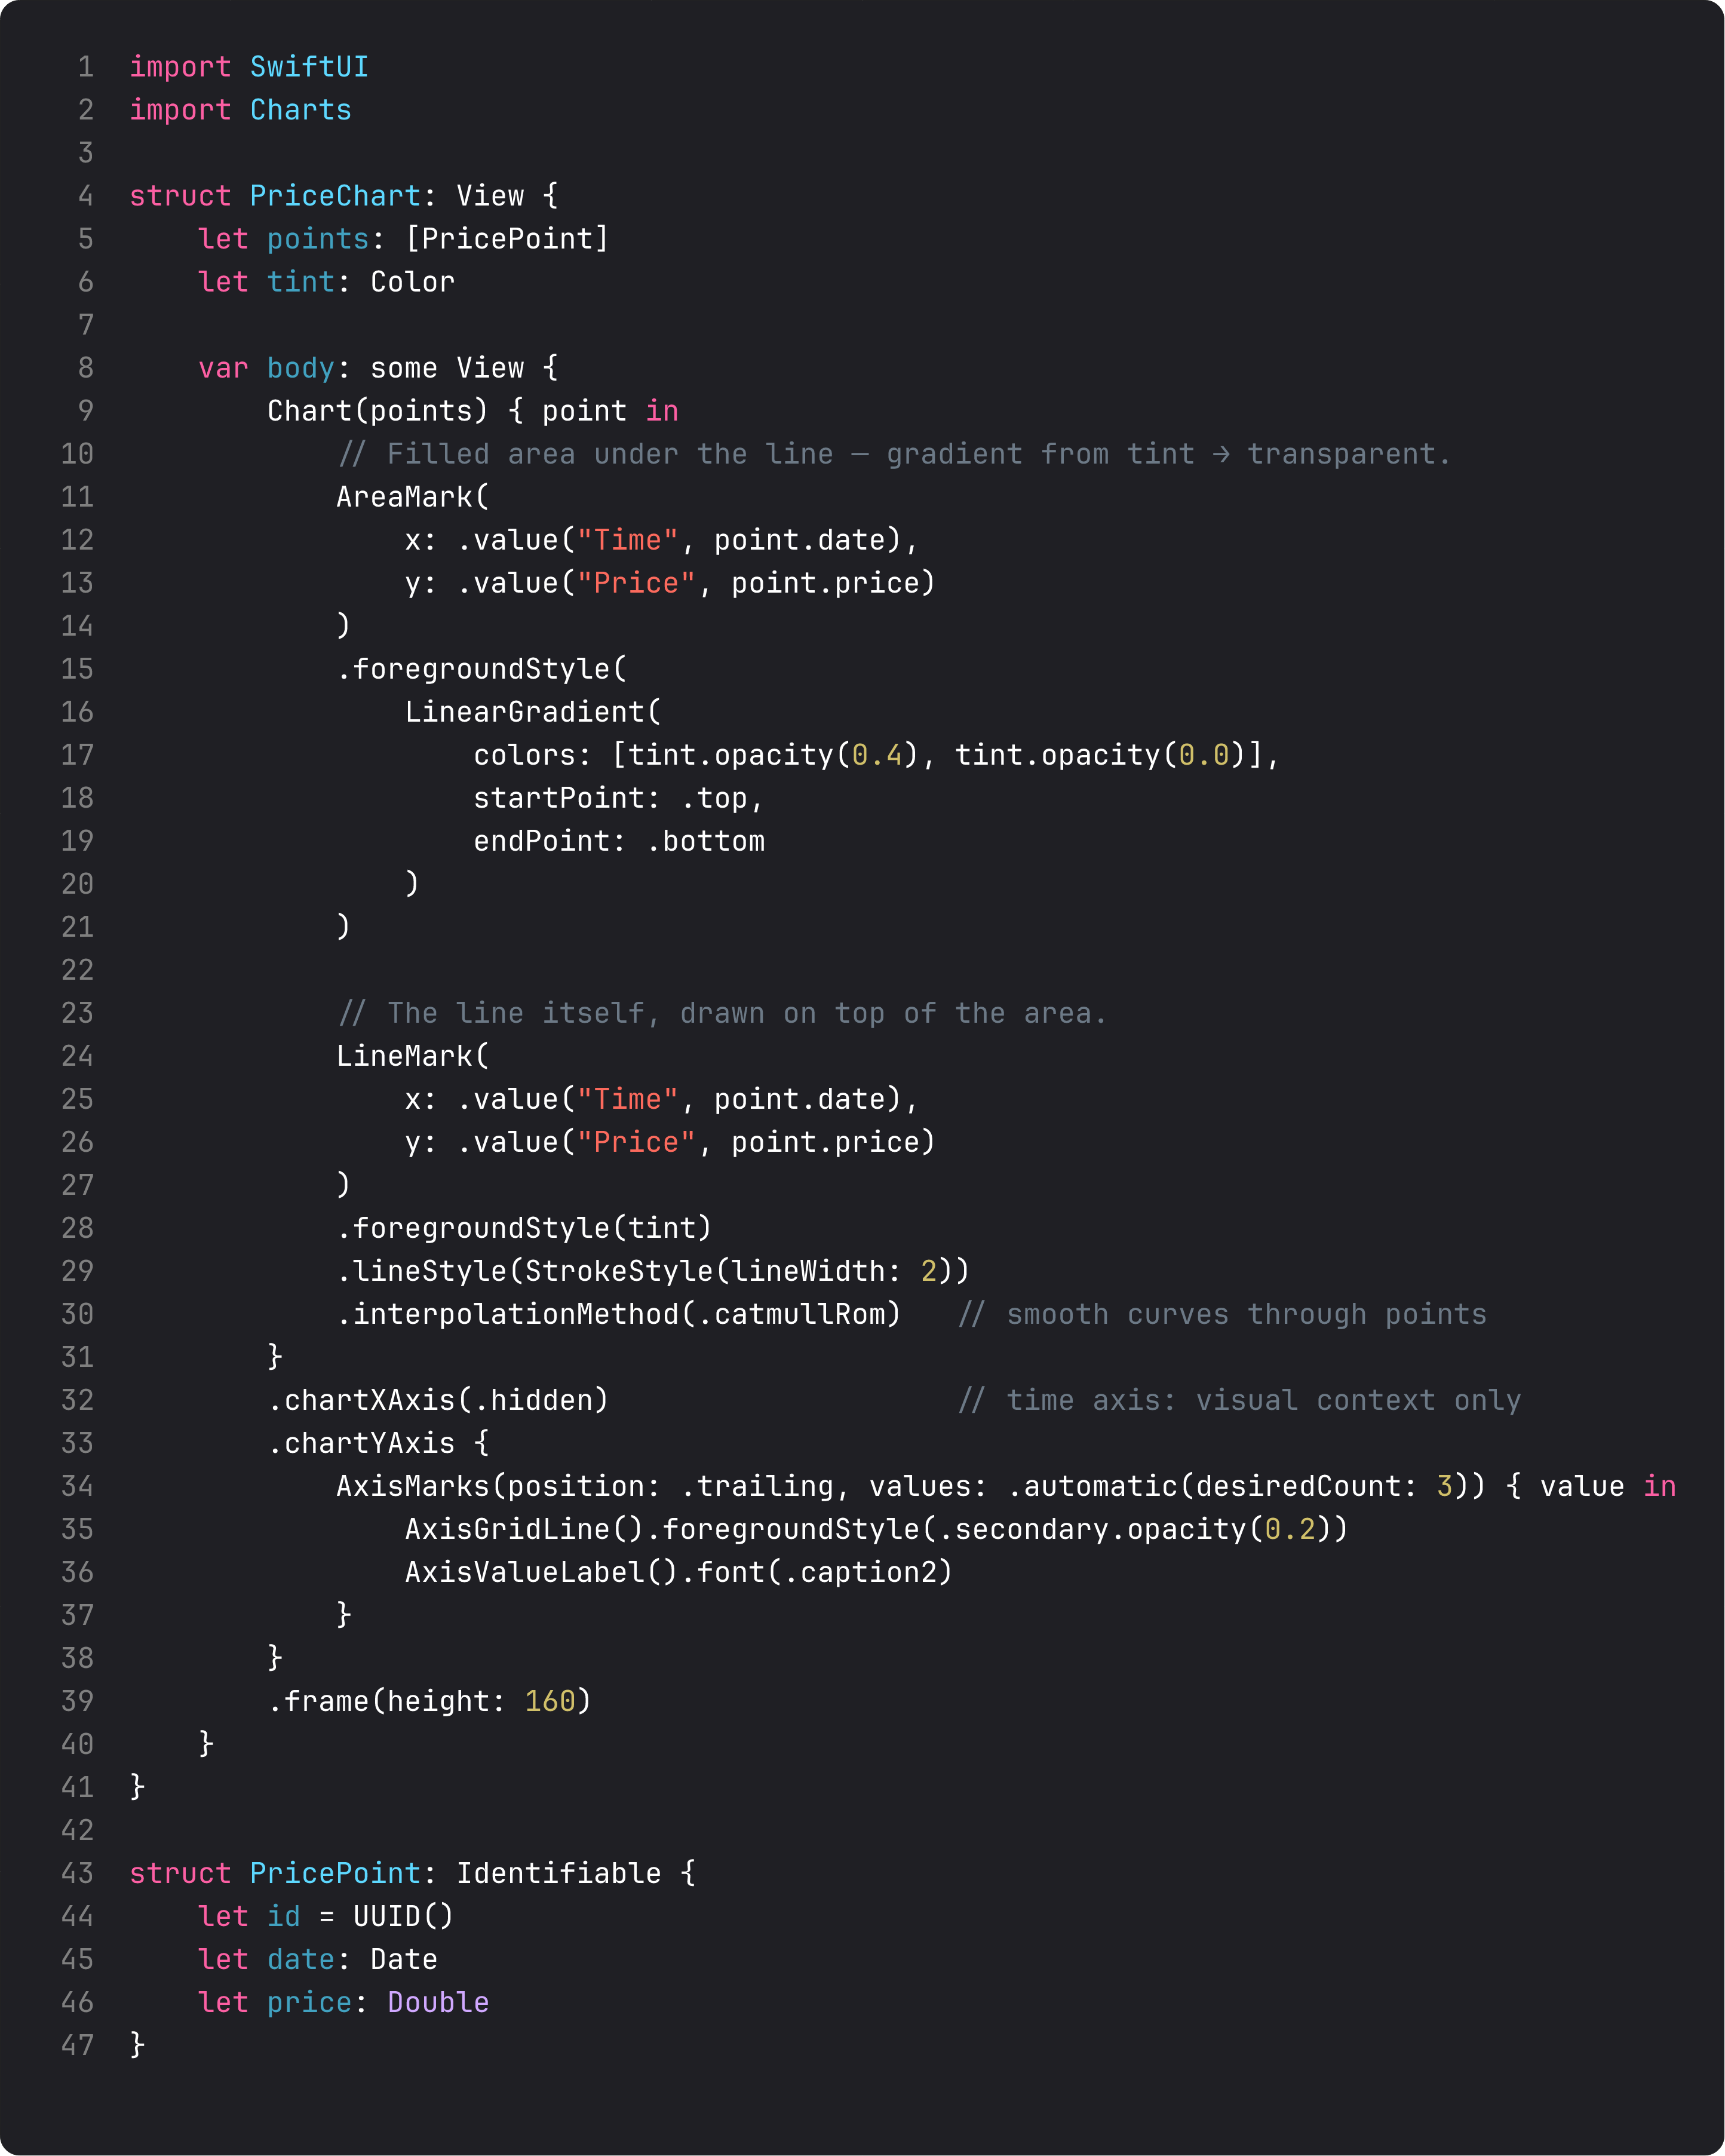
Three details that make it look pro:
- Marks compose.
Chart { AreaMark + LineMark }renders both, layered in declaration order. AreaMark first (background), LineMark on top. .foregroundStyle(LinearGradient(...))on the AreaMark is the visual that makes a chart go from “Excel” to “Apple Music.” Strong tint at the top, transparent at the bottom — emphasizes the line, fades into the canvas..interpolationMethod(.catmullRom)smooths the line through the points instead of jagged segment-by-segment. Use.linear(the default) when you want raw data;.catmullRomwhen the line should look like a price.
For Pulse today we generate synthetic 24h points from entry.price + entry.changePercent24h because CoinGecko’s free tier doesn’t include historical data. The day we wire a real history endpoint, only the data source changes — the chart code stays. That’s the pattern.
Axis customization — when to override defaults
Charts’ default axes are sensible. Customize when the defaults waste space or confuse the reader.
Three customizations you’ll do all the time:
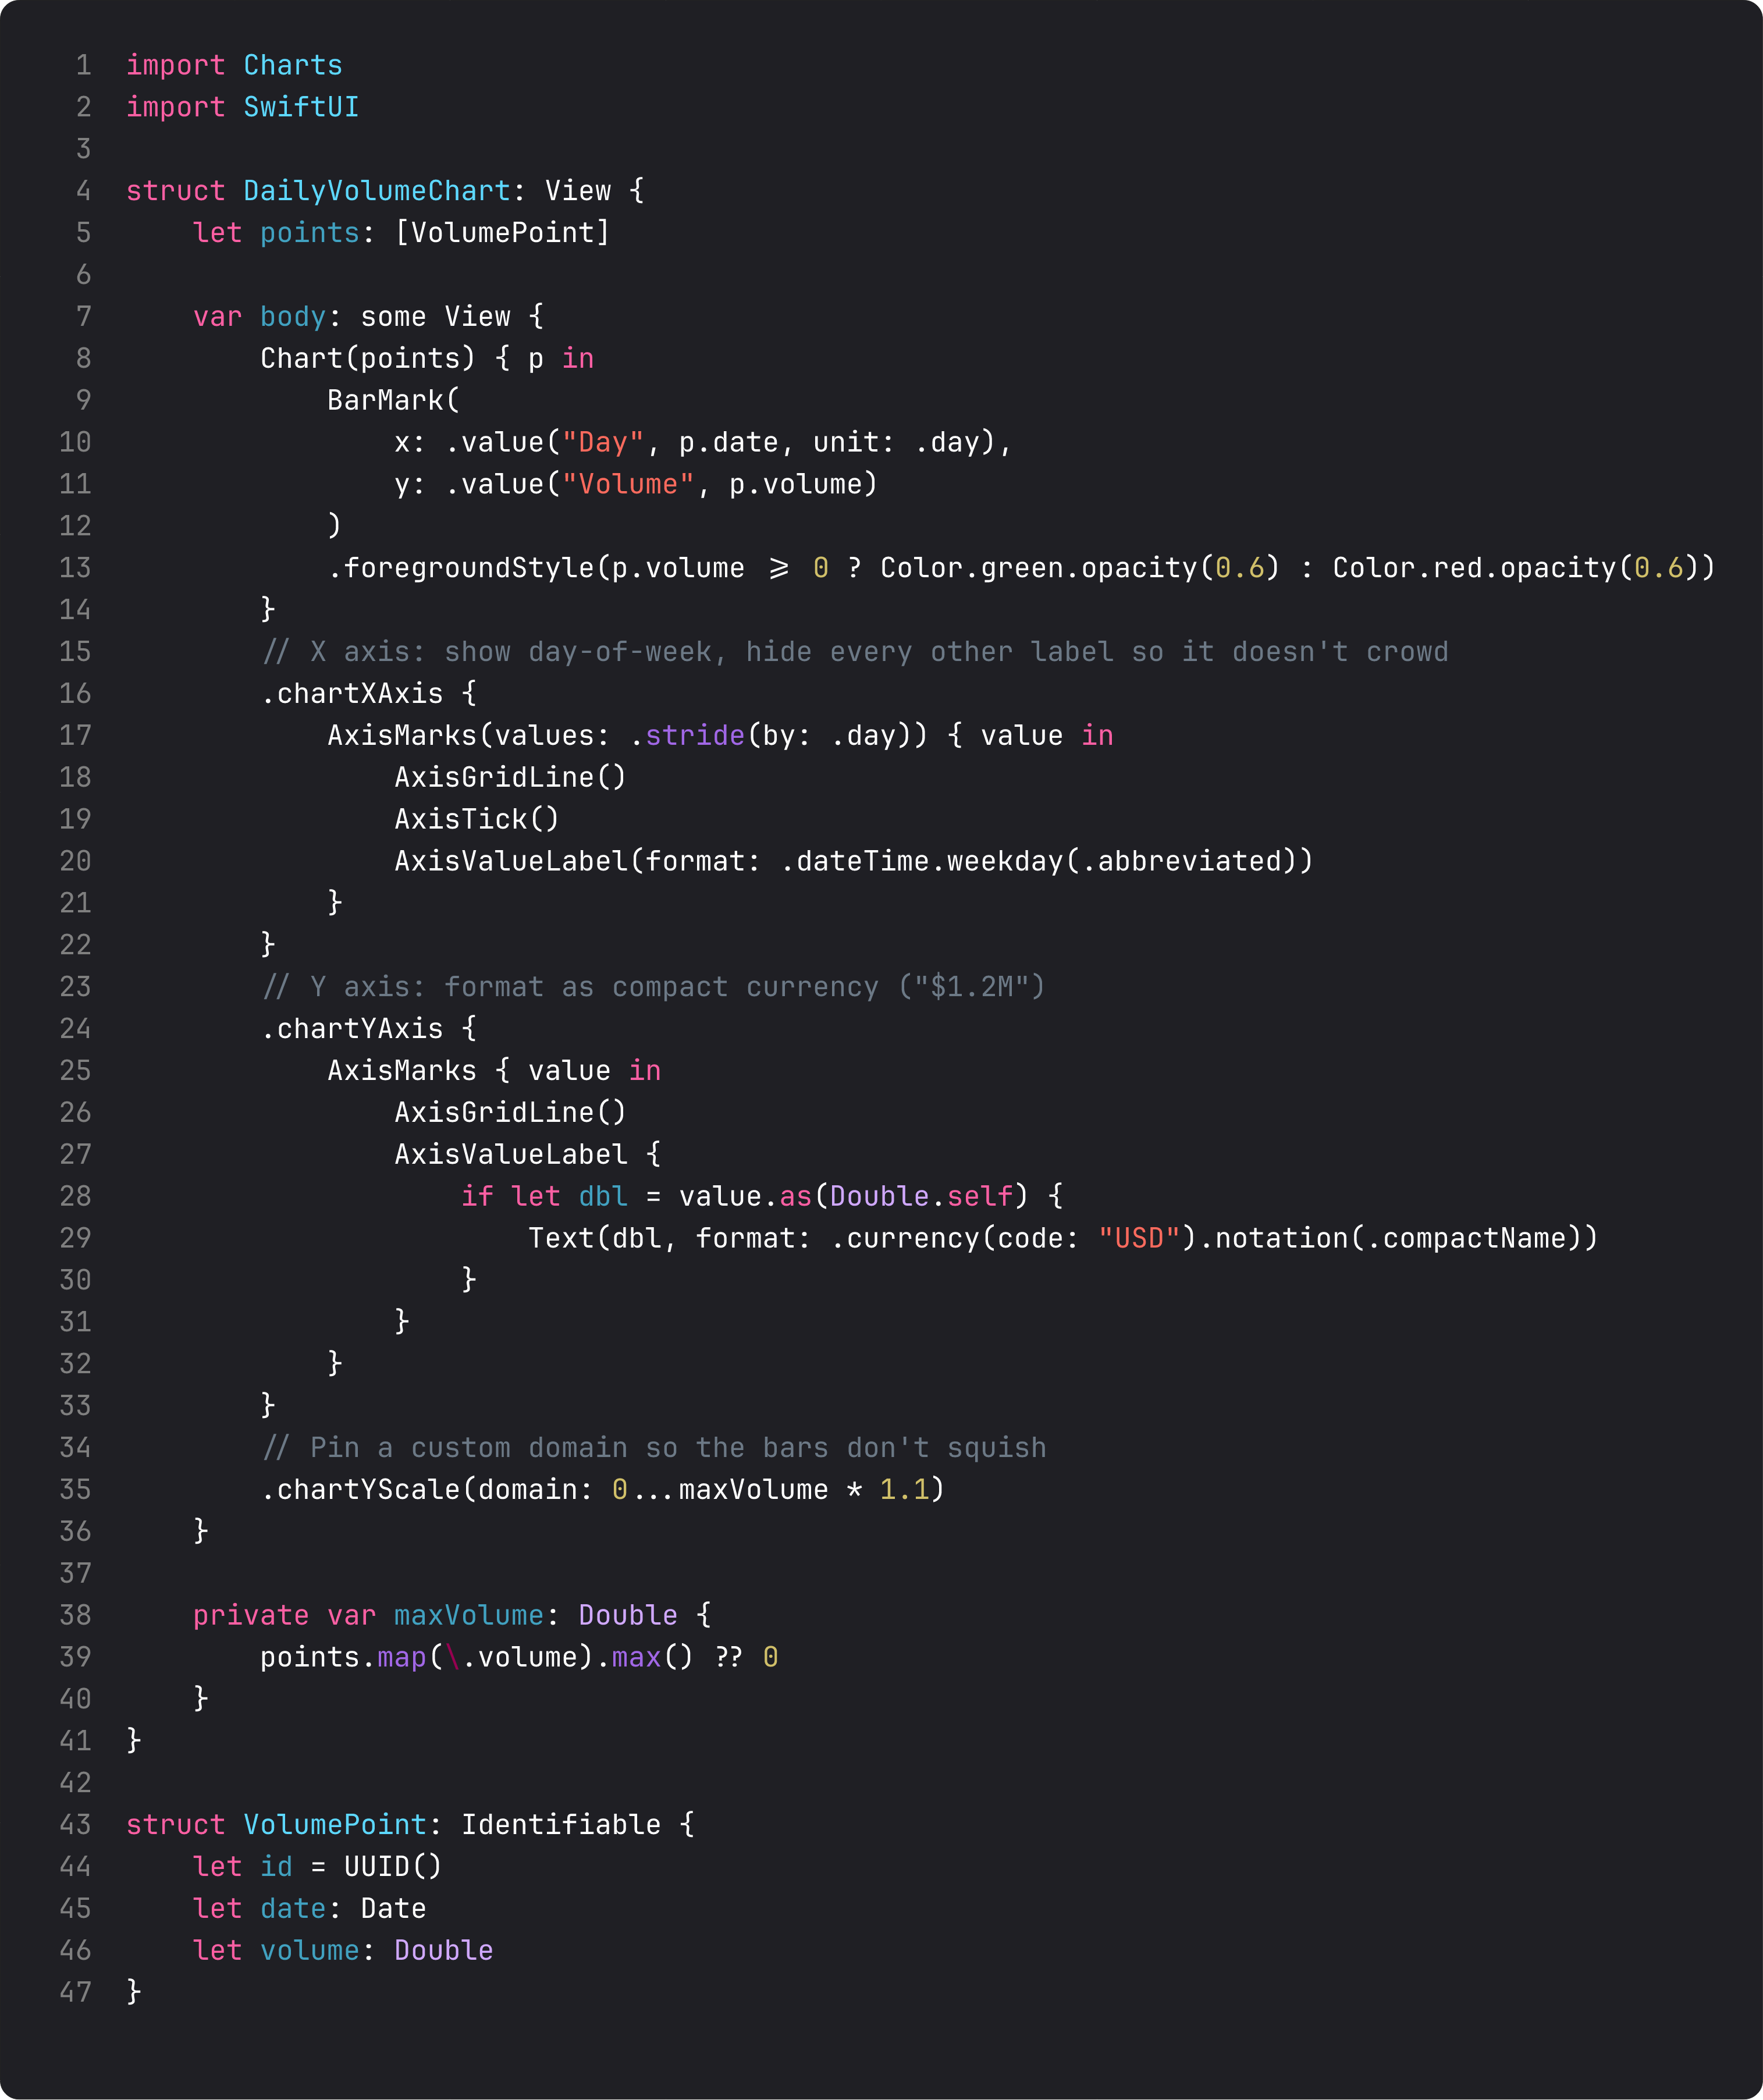
.chartXAxis(.hidden)— hide the time axis for sparklines where the trend matters more than the timestamps. Pulse’s price chart uses this; you don’t need to know “10:32:14” to read “the line is going up.”- Custom value formatting —
Text(dbl, format: .currency(code: "USD").notation(.compactName))renders 1_200_000 as “$1.2M” instead of “$1,200,000.00.” Compact notation is essential for axes; don’t make the user count zeros. .chartYScale(domain: 0...max * 1.1)— pin the Y axis with 10% headroom above the max value. Keeps the chart from squishing the bars to the top edge.
The default AxisMarks { value in ... } builder gives you full control over each axis tick — gridline, tick mark, and label. Override what you need; let the rest stay default.
Interactive selection — tap and drag (iOS 17+)
.chartXSelection(value:) binds a Date? to the chart’s drag-to-select gesture. Combine with a RuleMark and a PointMark.annotation(...) for the tap-to-inspect interaction every modern markets app has.
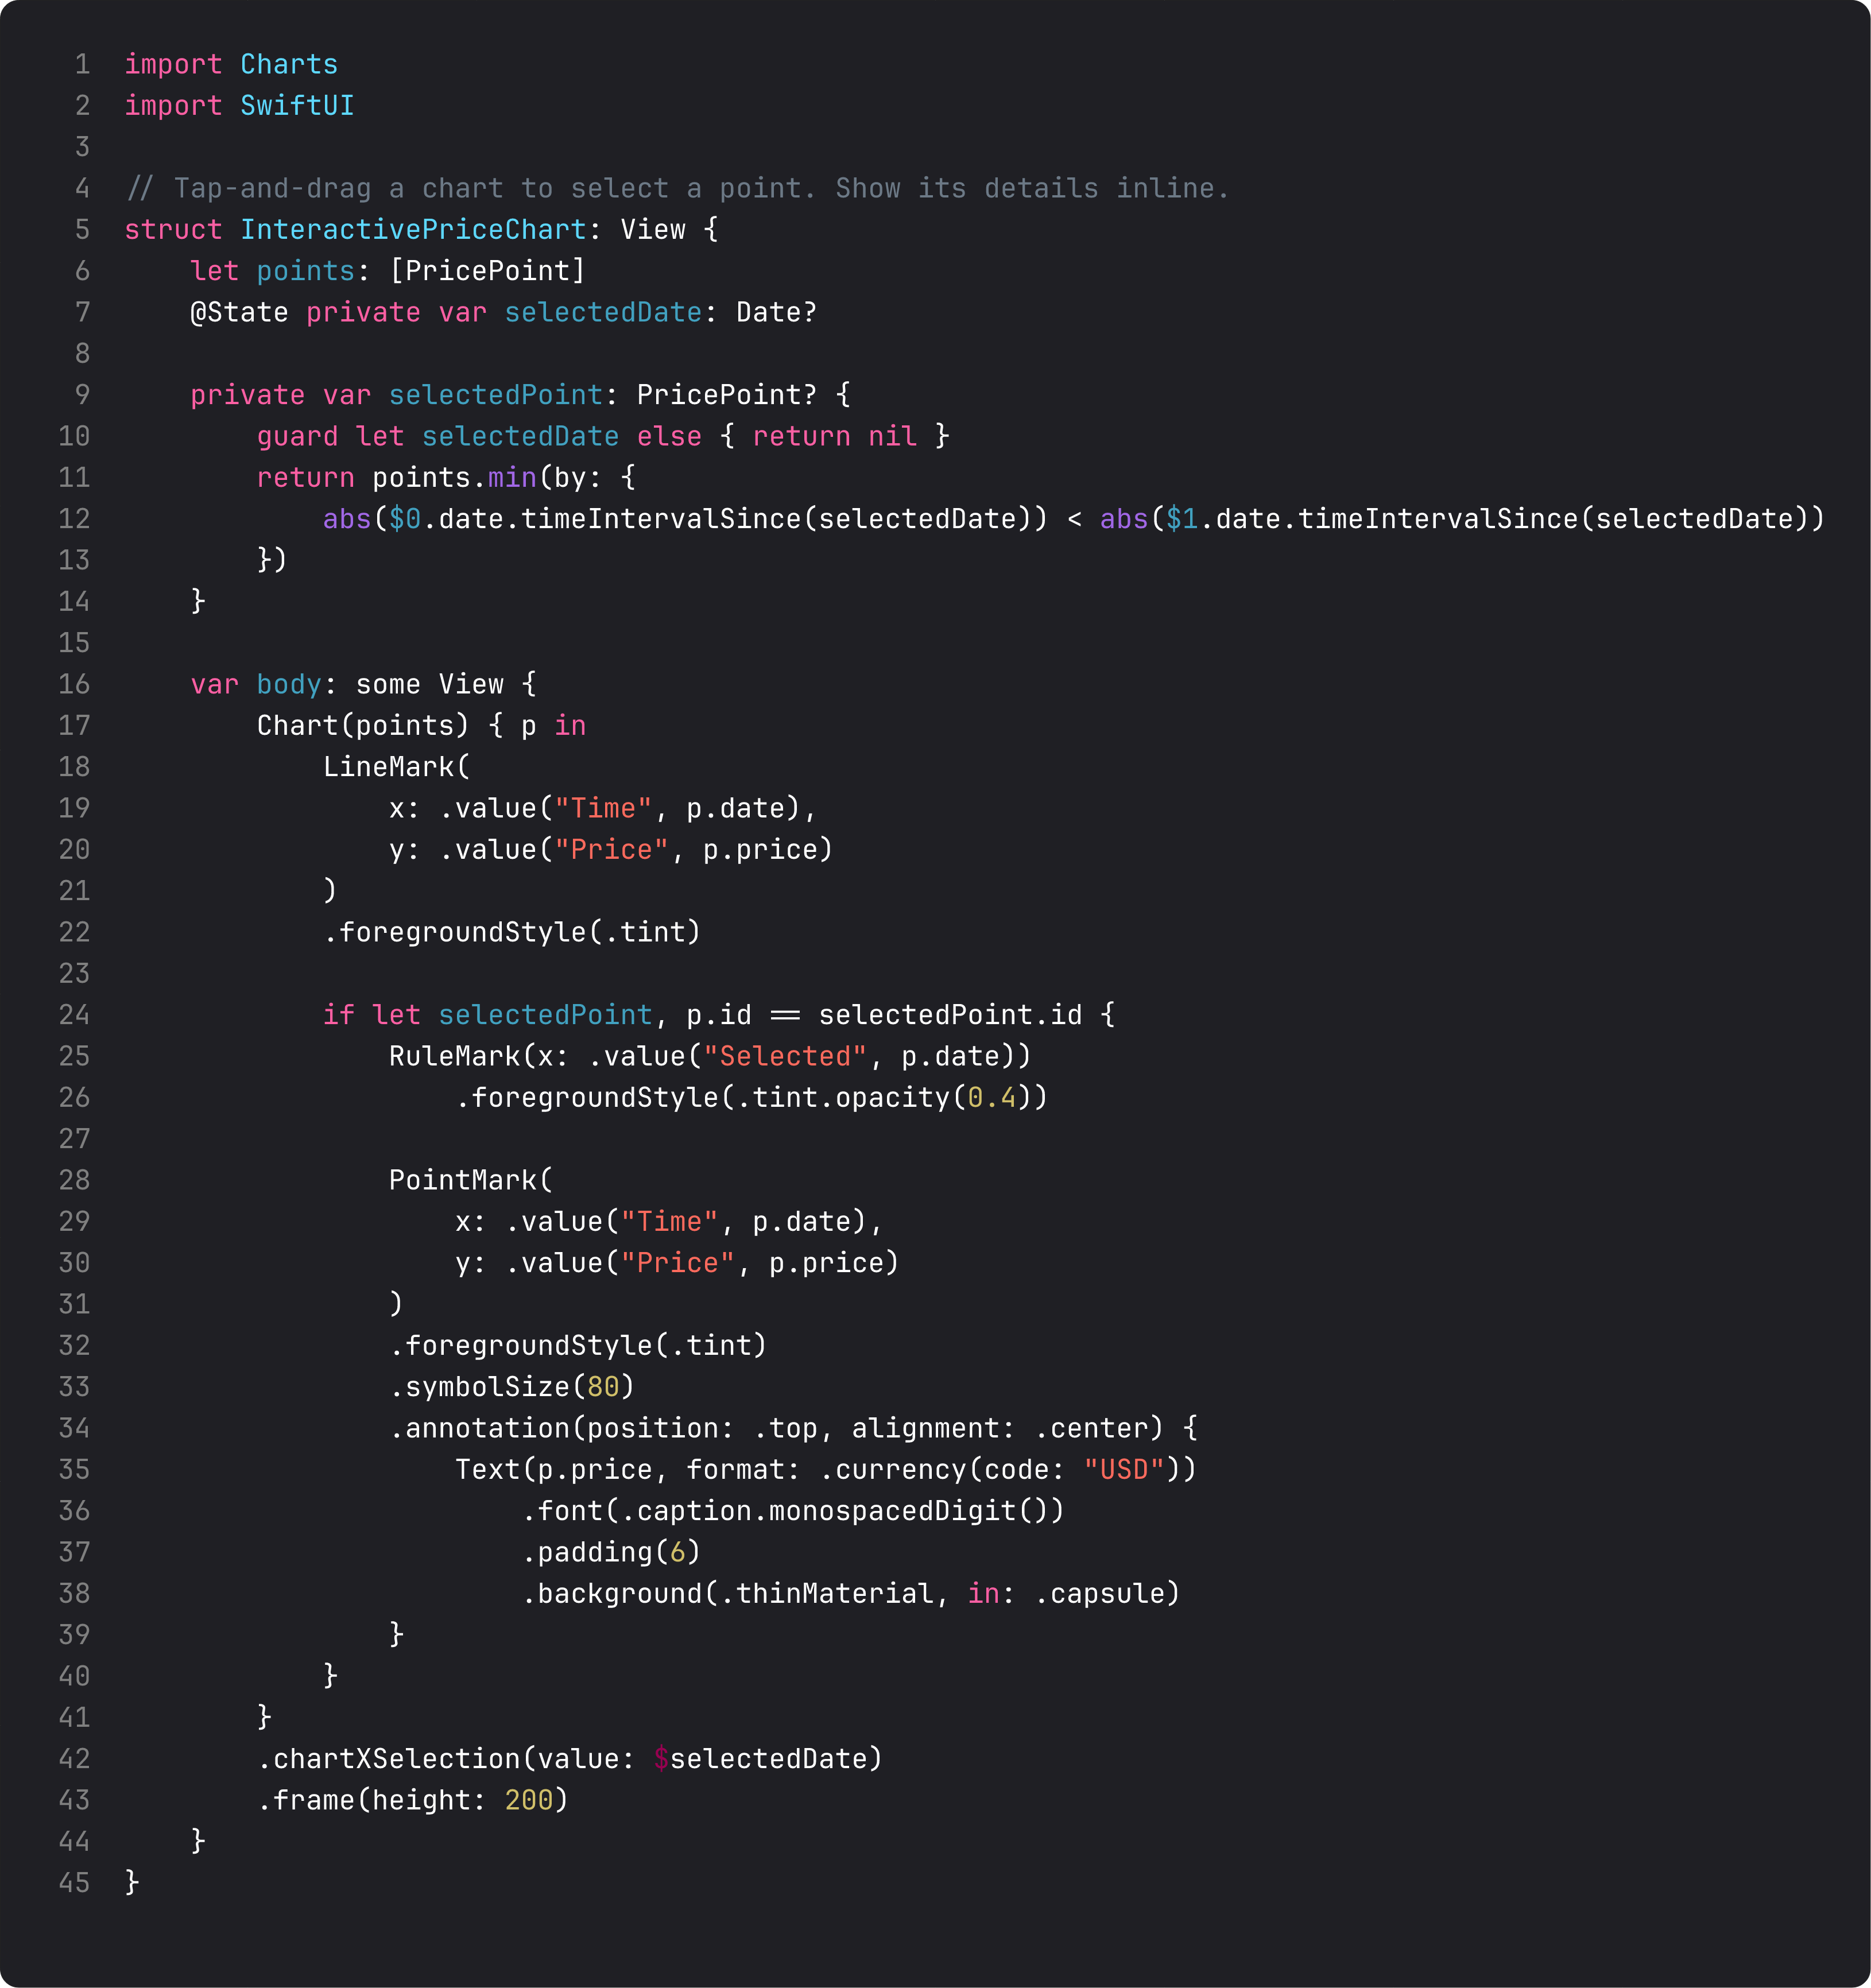
The pattern in three pieces:
@State private var selectedDate: Date?— bound to the chart’s selection. Drag → SwiftUI updates the binding to whatever date is closest to the drag location.RuleMark(x: .value(...))+PointMark— drawn conditionally only whenselectedPoint != nil. The vertical rule shows where the selection is; the point + annotation shows the value.- Snap to nearest point —
points.min(by: { abs($0.date.diff) < abs($1.date.diff) }). The drag gives you continuous Dates; you snap to whichever data point is closest. Otherwise the annotation jitters between data points.
Pulse doesn’t ship interactive selection today (the chart is decorative — full scrubbing would need real per-minute data). When that lands, the pattern’s already in place.
A trap I see weekly: building a chart from scratch
The vibe-coded version of “show a price line” before someone learns Charts:
GeometryReader { proxy in
    Path { path in
        for (i, point) in points.enumerated() {
            let x = CGFloat(i) / CGFloat(points.count - 1) * proxy.size.width
            let y = (1 - normalized(point.price)) * proxy.size.height
            if i == 0 { path.move(to: CGPoint(x: x, y: y)) }
            else { path.addLine(to: CGPoint(x: x, y: y)) }
        }
    }
    .stroke(Color.green, lineWidth: 2)
}
This works for one chart. By chart #3, you’re recreating axes, gridlines, accessibility, animation, and tap interactions. By chart #5, you’ve half-rebuilt Charts framework, badly.
Use the framework. The Chart { ... } block is no harder to write than the Path version, and you get axes, accessibility, animations, and the iOS-17 interactive selection for free. Custom drawing is a tool for when the framework genuinely can’t handle the visualization (radar charts pre-iOS 17, force-directed graphs, complex 3D), not for “I have data and I want a line.”
What it looks like running
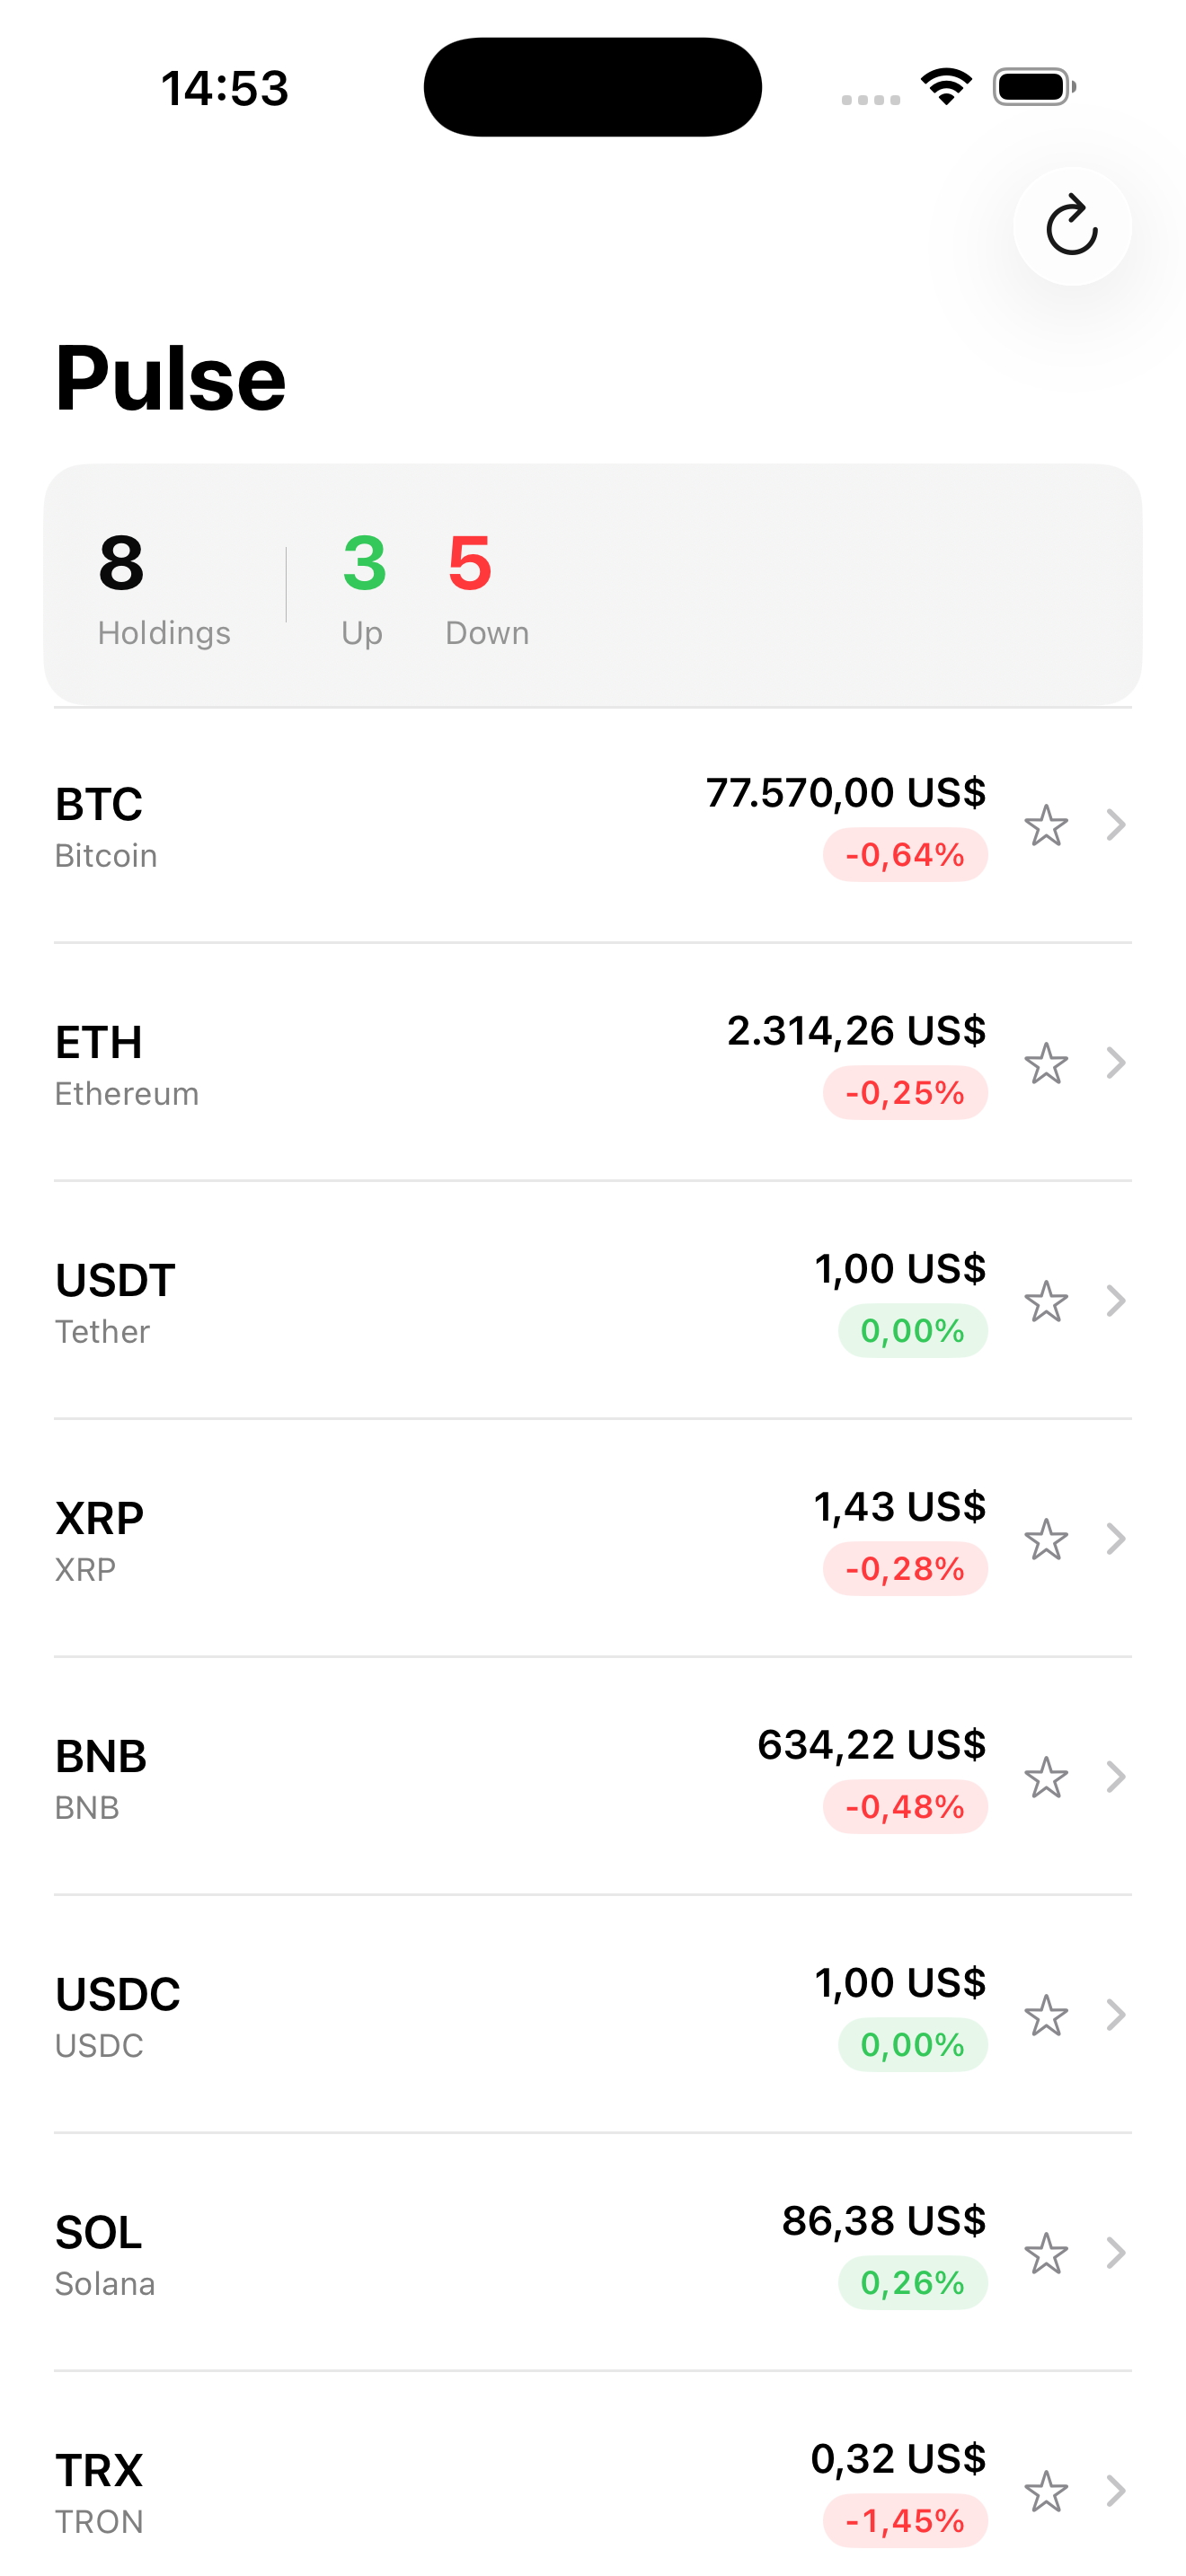
Tap a market on the home screen, swipe into the detail. The chart sits between the price block and the metrics grid — green line + soft green gradient for an up day, red for down. The line follows the implied 24h trajectory (synthetic, until we wire real history).
Takeaway
Chart { AreaMark + LineMark } is the sparkline pattern. Hide axes when context is implicit; customize formatting when the defaults waste space. .chartXSelection for tap-to-inspect (iOS 17+). Use the framework — don’t draw charts with Path.
Charts is one of the highest-leverage frameworks Apple shipped in the last five years. The investment to learn it is one afternoon; it pays back forever.
Next lesson: Swift 6 strict concurrency. We dig into the @MainActor, Sendable, and actor annotations Pulse has been quietly using and learn to read the diagnostic errors that are coming for everyone in this codebase.
NativeFirst Team
EditorialThe NativeFirst team — engineers and designers building native Apple apps and writing the courses we wish we had when we started.
Comments
Leave a comment